Table of contents
- What is linear regression
- Non-linear Regression
- Multicollinearity between variables
- The influence of outliers
What is linear regression ?
The general formula of the linear regression equation is as follows:
\[Y = β_1 * X_1 + β_2 * X_2 + β_3 * X_3 + ε\]- Y is the observation of the dependent variable
- X is the observation of the independent variable
- The values βj represent parameters to be estimated
- ε is an independent identically distributed normal error.
In this formulation, we can know two properties of linear regression.
(1) \(X_j\)(the independent variables) are independent of each other.
(2) There is a linear relationship between X and Y.
But, in some models, \(X_j\) is not independent and there may be a non-linear relationship between X and Y.
Non-linear Regression
In linear regression models we assume there is a linear relationship between variables. However, if the relationship is not linear, then the linear regression model may not perform as expected.
For example, the relationship that exists between y and x in \(y = sin(x)\)
When we use the linear regression model to fit it, the performance of the model is not perfect.
In the Taylor expansion, we can clearly explain this error. When the number of terms of the polynomial of the Taylor expansion is larger, the error will be smaller, and the number of parameters estimated at the same time will be larger. Thus, using a linear regression model is not a good method.
 <p>
<p>
Multicollinearity between variables
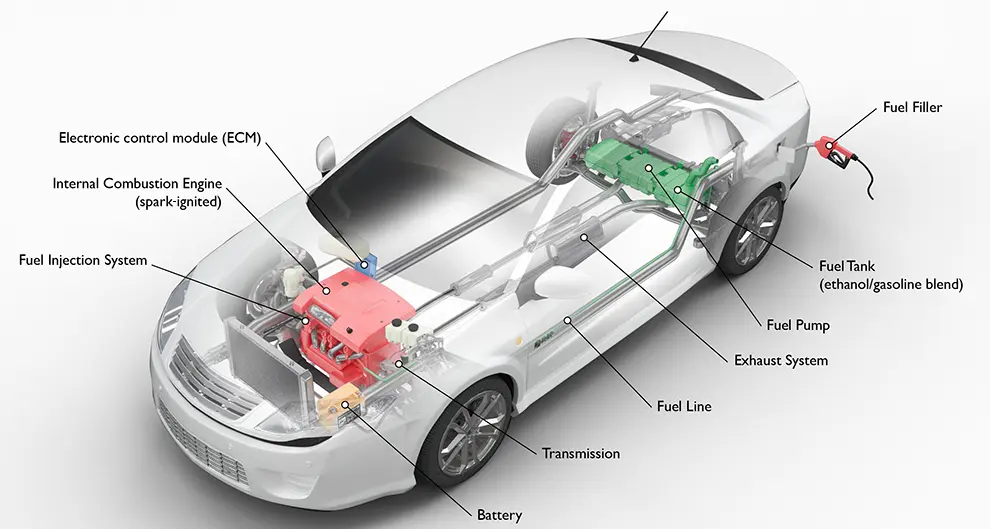
We use a classic example, the price of the car, to explain the disadvantage of a linear regression model.
Building a multiple regression model to evaluate the price of the car, the specific form of which is as follows:
- Price = -55089.98 + 87.34 x engine size + 60.93 x horsepower + 770.42 x width
 <p>
<p>
Figure 1. Car Components
The model predicts or estimates the price of a car based on engine size, horsepower, and width. The multivariate regression model assumes that the predictors are independent of each other, i.e. engine size, horsepower, and width are uncorrelated and independent.
Actually, variables are rarely independent of each other. What if there is a relationship between horsepower, engine size, and width? Can these relationships be explained by the model?
The independence of the variables means that if one variable changes, the target will be affected. This effect is independent of the presence and variation of another variable, and the relationship between the target and variable is additive and linear.
In the car price model, if we consider the influence of the engine, then changing one unit of engine size changes the price of the car by 87.34. However, that explanation doesn’t take into account the link between the horsepower and width of a car and the size of the engine. Are cars getting bigger and bigger engines?
In this model, there is a relationship between the width and engines. Therefore, using a linear regression model will not explain the relationship between width and engines.
The influence of outliers
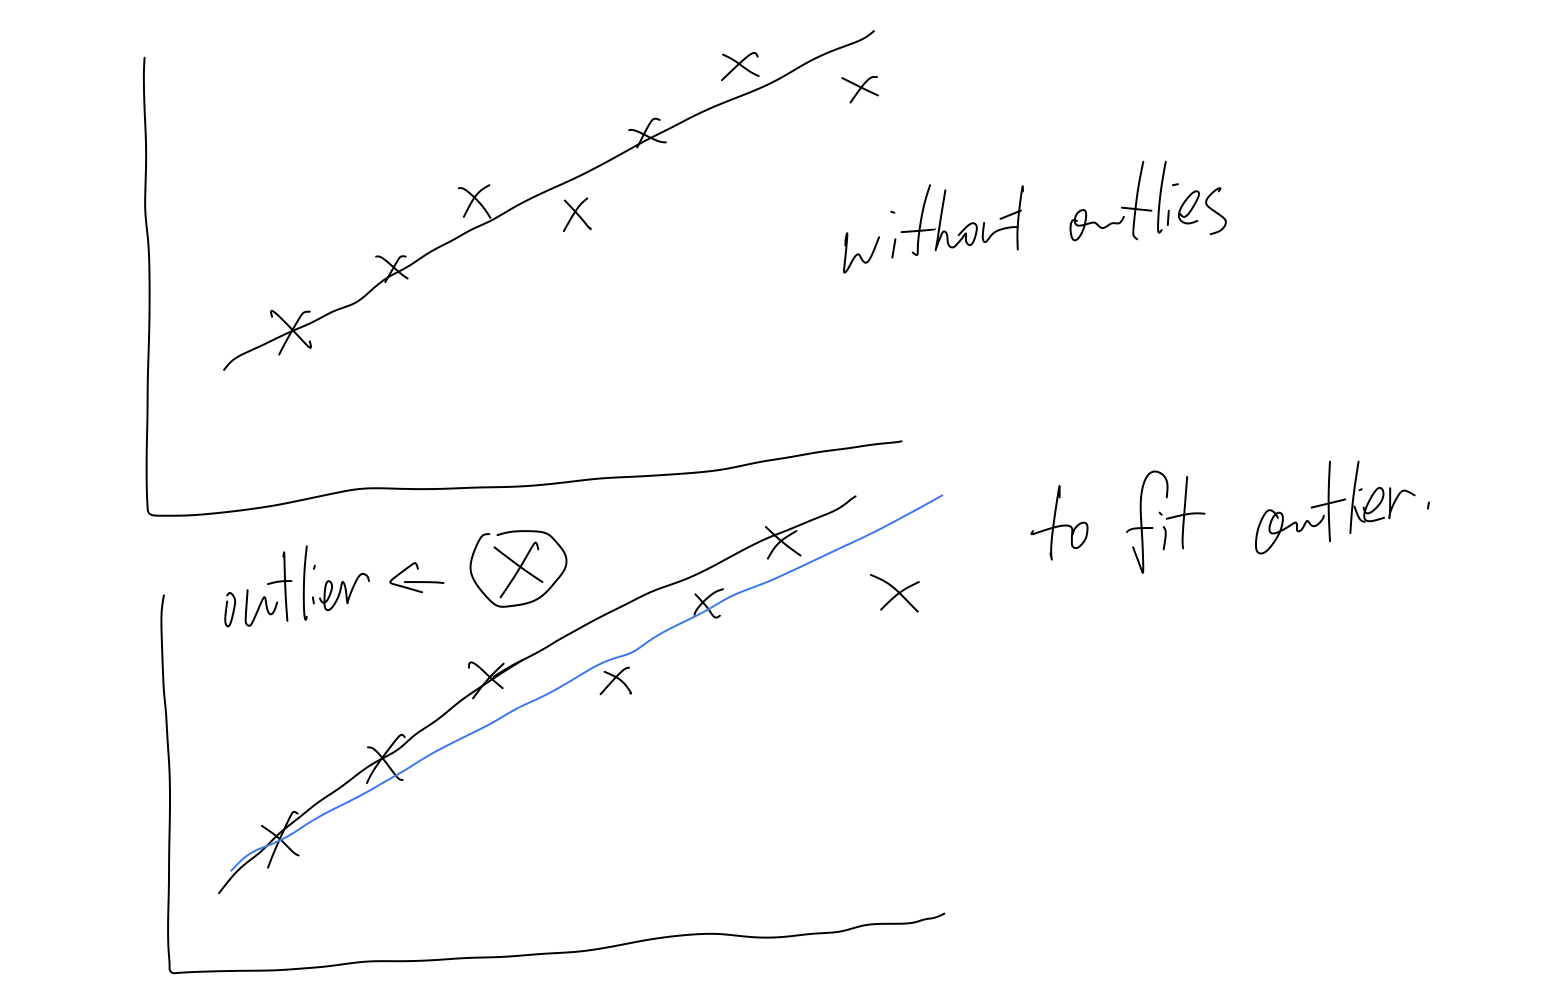
The outlier is a point that is far from a value predicted by the model. If there are outliers in the target variable, the model will be stretched to fit them. For the linear regression model, the few outliers will make the model to make many adjustments. This makes the model prone to outliers. In any circumstance, there is no benefit to the fit of the model.
The linear regression model is prone to outliers. If in the pre-procressing step, we cannot clean the data well, the performance of the model will be worse. In the linear regression model, OLS is used as the loss function to evaluate the parameter. When there are outliers in the data, the ordinary least squares(OLS) method will make the model fit to the outliers.
 <p>
<p>
Figure 2. Effect of Outliers on Linear Regression
This picture clearly shows that the linear regression model is sensitive to outliers.