- Lab Credits:
- Blog Credits: Sai Akhilesh Ande
Overview
In this Lab, we will we extend the FastAPI Lab-1 to create an user friendly interface(frontend) using Streamlit.
Prerequisites
- FastAPI Lab-1 (required)
Setting up the lab
Note: If you’d like to save your work files to GitHub, setup your working directory similar to Github Lab-1 and add necessary files to .gitignore. If you just want to run the lab locally, follow the below steps.
- Open the local mlops_labs directory using Visual Studio Code(VSC) and open a new terminal inside VSC.
- Create a new working directory for this lab(e.g. streamlit_lab1).
- Move into the working directory using the command cd streamlit_lab1 in your terminal.
- Create a virtual environment(e.g. streamlit_lab1_env).
- Activate the environment and install the required packages using
pip install -r requirements.txt.
Note:
- fastapi[all] in requirements.txt will install optional additional dependencies for fastapi which contains uvicorn too.
Project structure
mlops_labs/
├── fastapi_lab1/
│   ├── ...
│   └── ...
└── streamlit_lab1/
    ├── assets/
    ├── data/
    │   └── test.json
    ├── src/
    │   ├── __init__.py
    │   └── Dashboard.py
    ├── streamlit_lab1_env/
    ├── README.md
    └── requirements.txt
Running the Lab
- Move into
srcfoldercd src - Open Dashboard.py file and update the variable
FASTAPI_IRIS_MODEL_LOCATIONwith the path to the model.pkl file from FastAPI lab1. - Run the streamlit server.
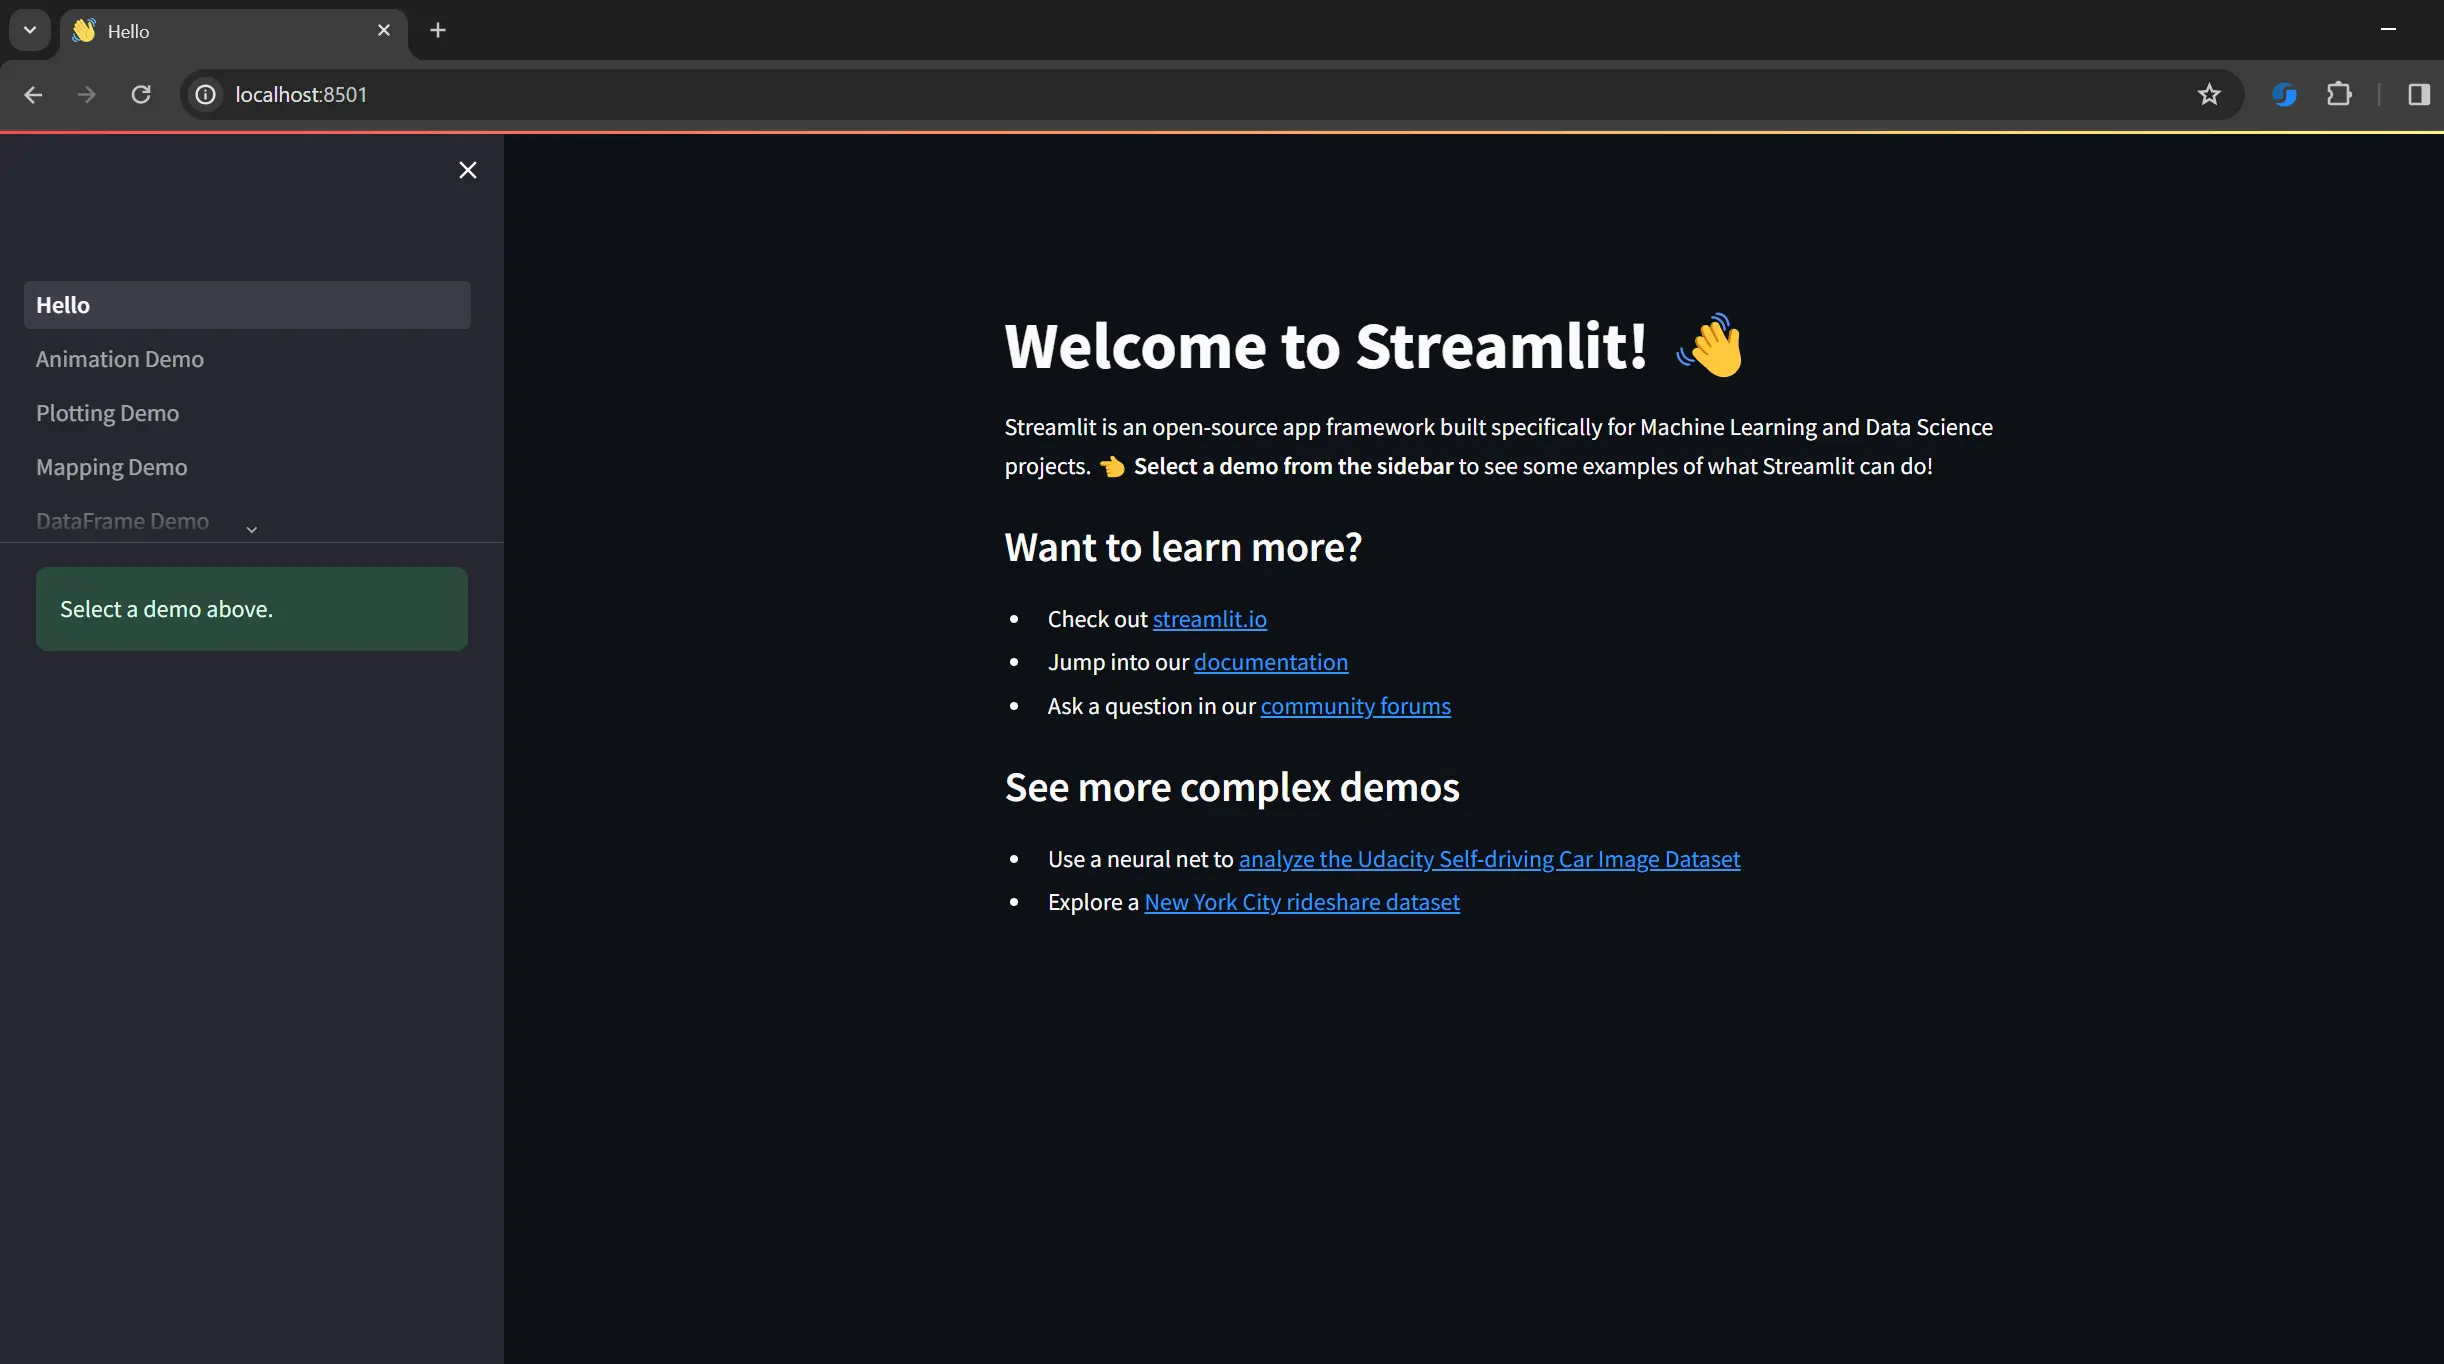
streamlit run Dashboard.pyThe server will be launched and running at http://localhost:8501
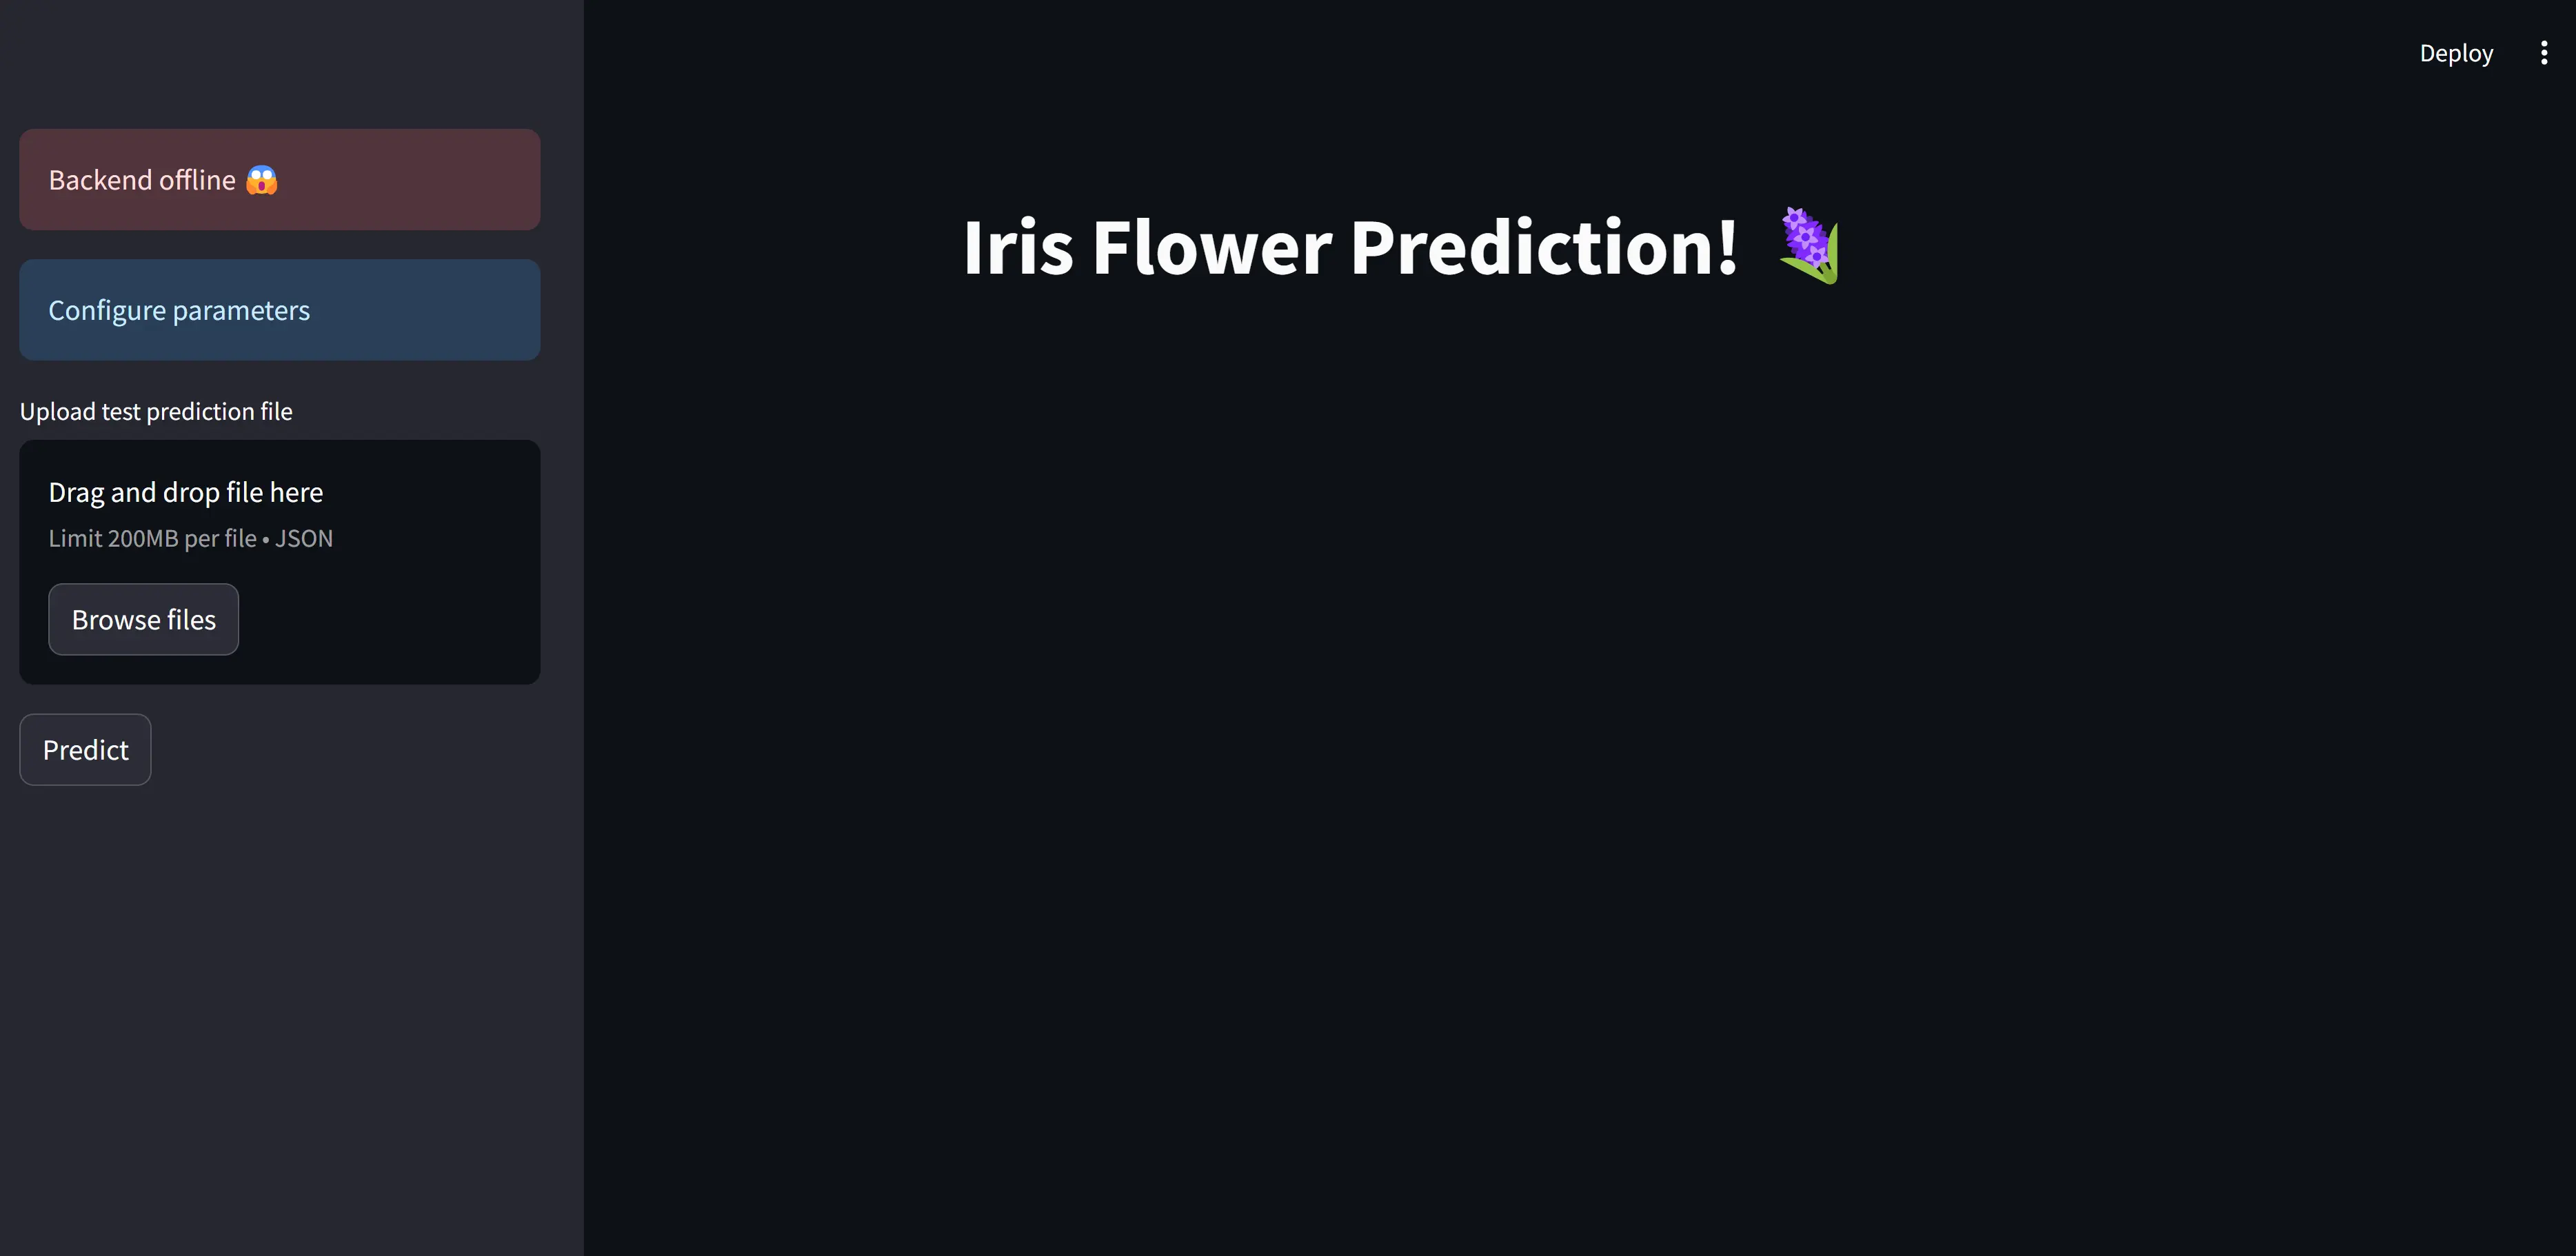
- We see that the Backend is offline. This is because, we only launched the front-end interface using Streamlit. To launch the backend, we need to run FastAPI instance as we did in the FastAPI lab1. For this, open a new terminal in VSC.
- Move into FastAPI folder, activate the FastAPI lab’s virtual environment and move into src folder.
cd /fastapi_lab1/ # windows .\fastapi_lab1_env\Scripts\activate # linux/macOS source ./fastapi_lab1_env/bin/activate cd /src - Run the following command to serve the model as an API.
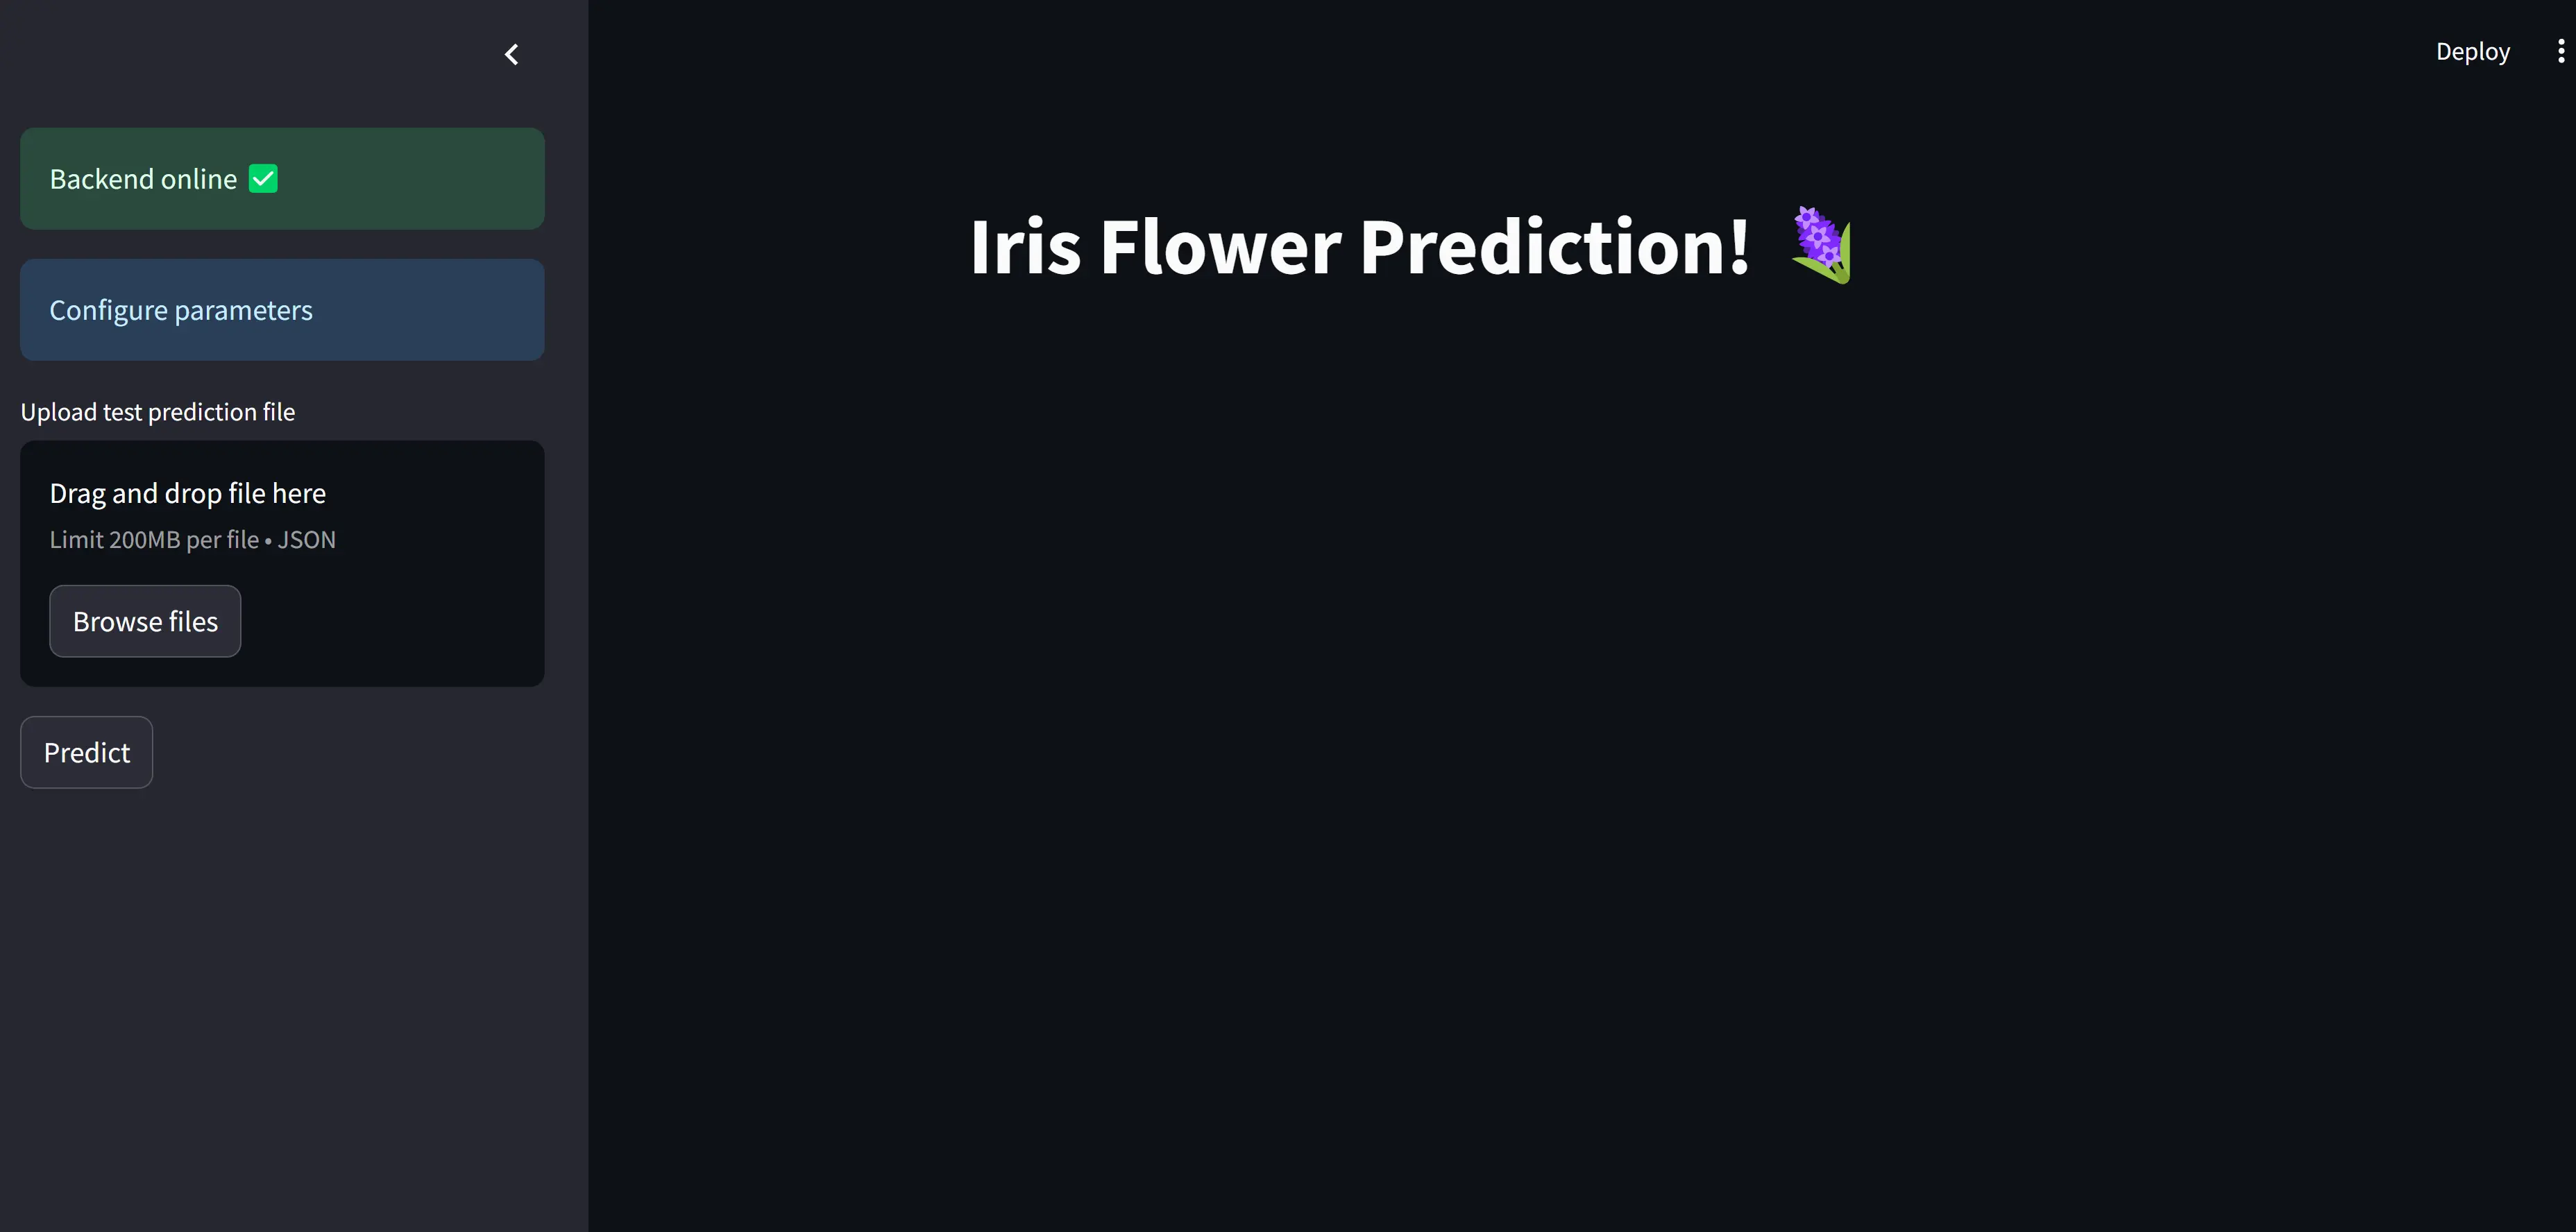
uvicorn main:app --reload - Now, refresh the Streamlit webpage. You will notice that the backend is online.
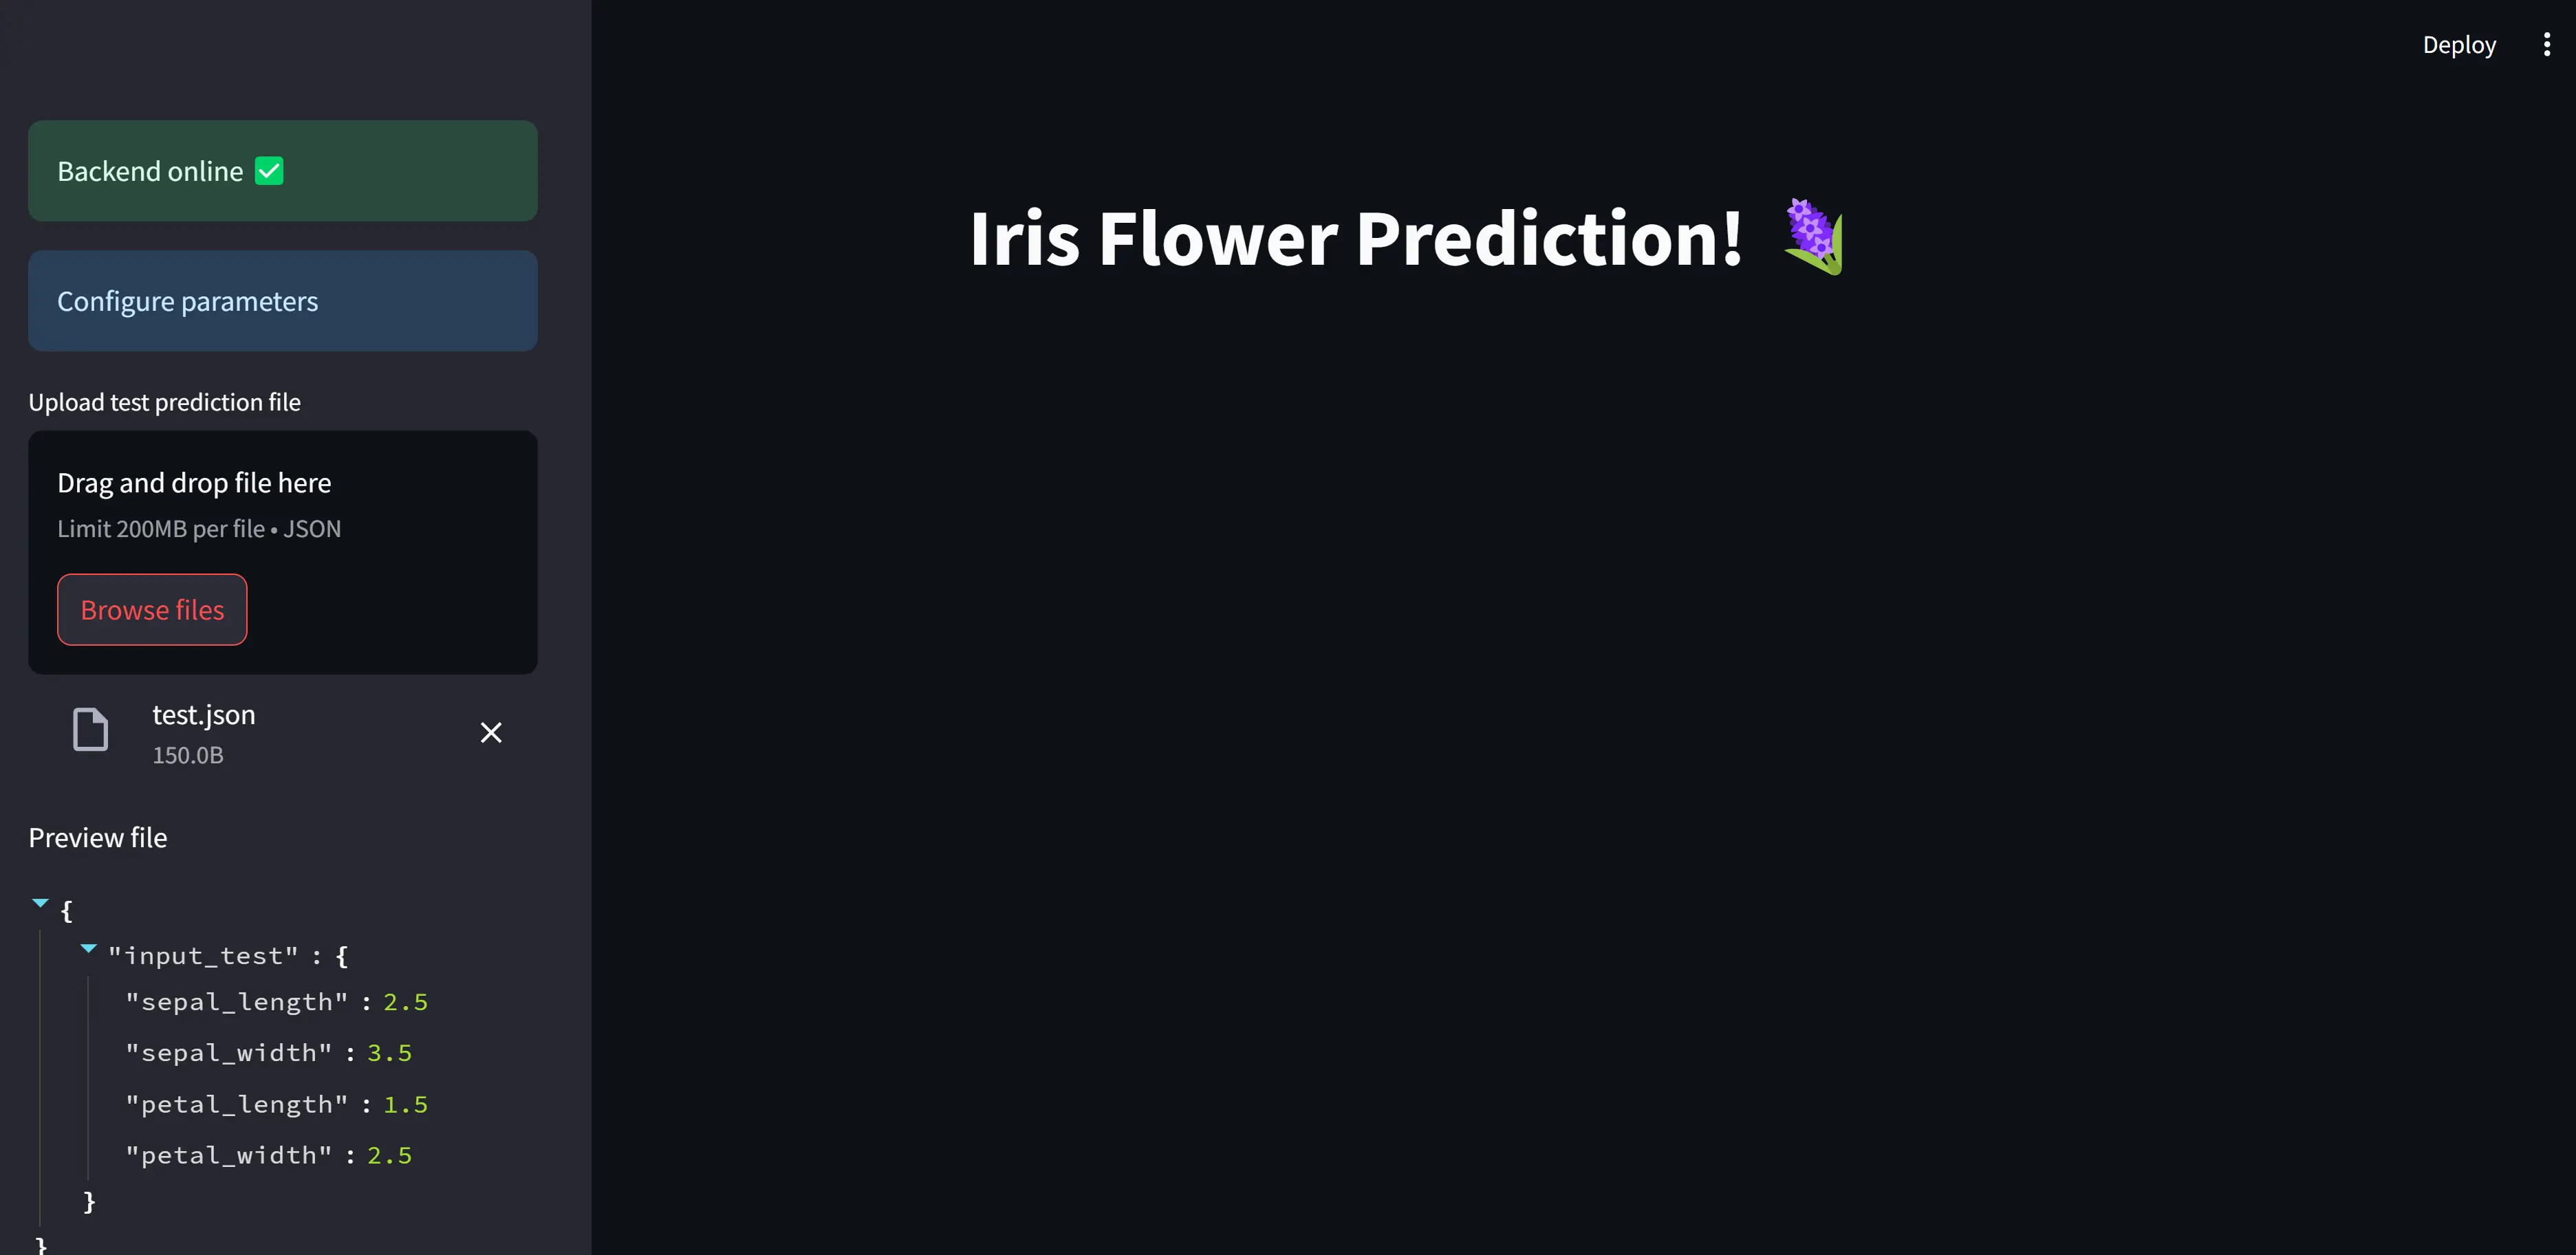
- Now, Click on “Browse files” and upload the test.json file located at streamlit_lab1/data/test.json. You will see the preview of the json file once uploaded.
- Click on predict button. The model will predict on the test datapoint in
test.jsonand returns the name of the Iris flower class it belongs to.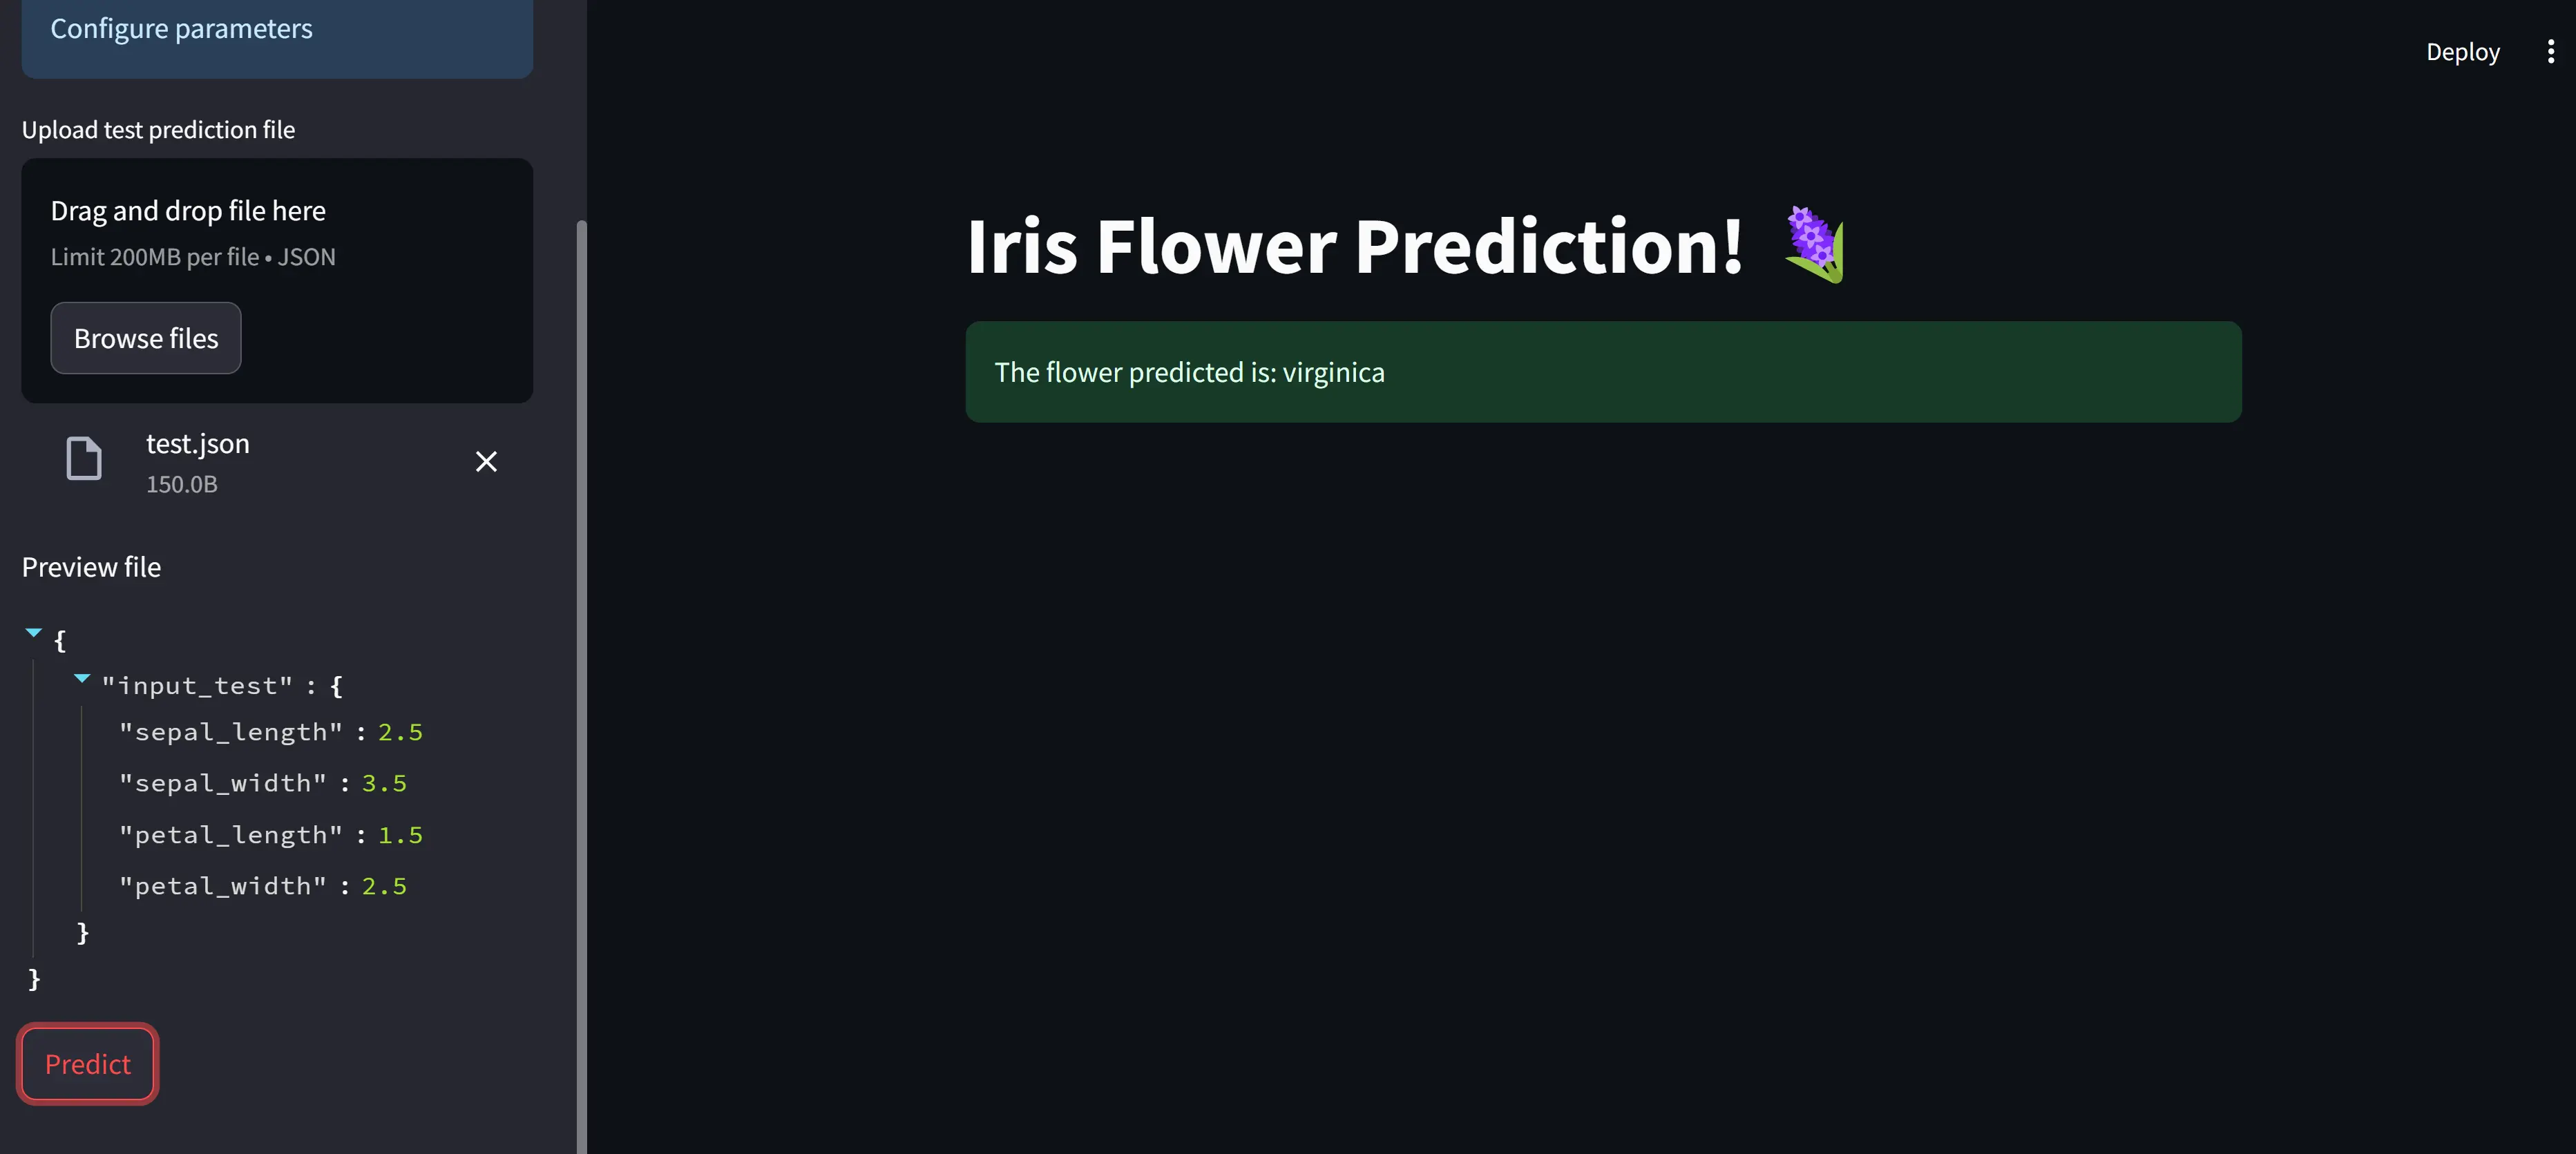
Streamlit Introduction
Data Science models often need to be shared and presented in an interactive manner for various applications. Streamlit provides a convenient platform to build user-friendly interfaces, allowing practitioners to showcase their remarkable machine learning models to a broader audience effectively.
Hello World in Streamlit
The best way to explore a new package is to start with the hello world equivalent. So, to run the streamlit application,
streamlit hello
This will start a server on default port 8501 with an interactive dashboard. The hello world streamlit dashboard showcases some intresting usecases, so don’t forget to click around and explore further.
Building the UI Step-by-step
When creating a dashboard, the initial phase involves determining its layout structure. For this particular demonstration, we will incorporate a side panel and a primary body section. The side panel will serve as a navigation tool, enabling us to access various pages within the application, monitor the health of the backend system, and input test features for the model.
Building the sidebar
import json
import requests
import streamlit as st
from pathlib import Path
from streamlit.logger import get_logger
FASTAPI_BACKEND_ENDPOINT = "http://localhost:8000"
FASTAPI_IRIS_MODEL_LOCATION = Path(__file__).resolve().parents[2] / 'FastAPI_Labs' / 'src' / 'iris_model.pkl'
LOGGER = get_logger(__name__)
def run():
    st.set_page_config(
        page_title="Iris Flower Prediction Demo",
        page_icon="🪻",
    )
    with st.sidebar:
        try:
            backend_request = requests.get(FASTAPI_BACKEND_ENDPOINT)
            if backend_request.status_code == 200:
                st.success("Backend online ✅")
            else:
                st.warning("Problem connecting 😭")
        except requests.ConnectionError as ce:
            LOGGER.error(ce)
            LOGGER.error("Backend offline 😱")
            st.error("Backend offline 😱")
        st.info("Configure parameters")
        # sepal_length = st.slider("Sepal Length",4.3, 7.9, 4.3, 0.1, help="Sepal length in centimeter (cm)", format="%f")
        # sepal_width = st.slider("Sepal Width",2.0, 4.4, 2.0, 0.1, help="Sepal width in centimeter (cm)", format="%f")
        # petal_length = st.slider("Petal Length",1.0, 6.9, 1.0, 0.1, help="Petal length in centimeter (cm)", format="%f")
        # petal_width = st.slider("Petal Width",0.1, 2.5, 0.1, 0.1, help="Petal width in centimeter (cm)", format="%f")
        test_input_file = st.file_uploader('Upload test prediction file',type=['json'])
        if test_input_file:
            st.write('Preview file')
            test_input_data = json.load(test_input_file)
            st.json(test_input_data)
            st.session_state["IS_JSON_FILE_AVAILABLE"] = True
        else:
            st.session_state["IS_JSON_FILE_AVAILABLE"] = False
        predict_button = st.button('Predict')
if __name__ == "__main__":
    run()
Let’s break down the code and comprehend the design steps.
import json
import requests
import streamlit as st
from pathlib import Path
from streamlit.logger import get_logger
We begin by importing the necessary modules:
- json library will help us to send and receive information from the FastAPI
- requests library facilitates communication between the streamlit server and model server
- streamlit library is for the front-end dashboard. It has its own logger for debugging purposes
- pathlib will help navigate our local file system
Inside the run function, we start by customizing the title and icon for the browser tab:
st.set_page_config(
        page_title="Iris Flower Prediction Demo",
        page_icon="🪻",
    )
This following statement is the beginning of a context manager block that creates a sidebar in the Streamlit app. The st.sidebar object provides access to various methods and functions for creating user interface elements within the sidebar area of the Streamlit app.
To verify the operational status of the FastAPI server, send an HTTP GET request to the server. If the server is running and functioning correctly, it will respond with an HTTP status code of 200 (OK). For detailed explanations of HTTP methods (such as GET, POST, PUT, DELETE) and their corresponding status codes, refer this.
with st.sidebar:
    backend_request = requests.get(FASTAPI_BACKEND_ENDPOINT)
        if backend_request.status_code == 200:
            st.success("Backend online ✅")
        else:
            st.warning("Problem connecting 😭")
    except requests.ConnectionError as ce:
        LOGGER.error(ce)
        LOGGER.error("Backend offline 😱")
        st.error("Backend offline 😱")
The following components are used to show different colored boxes:
st.success: shows a green box with message
st.info: shows a blue box with message
st.warning: shows a yellow box with message
st.error: shows a red box with message
To allow users to select the sepal length, sepal width, petal length, and petal width, we will create sliders for each of these features. The sliders will have a range from the minimum to the maximum value observed for the respective feature in the dataset. You can adjust the minimum and maximum bounds of the sliders as needed.
sepal_length = st.slider("Sepal Length",4.3, 7.9, 4.3, 0.1, help="Sepal length in centimeter (cm)", format="%f")
Here the parameters are explained below:
label: The name of the slidermin_value: The minumum value for the slider rangemax_value: The maximum value for the slider rangevalue: The starting value for the sliderstep: The step increment for the sliderhelp: ? icon indicating more information on hovering- format: Additional format specifier. Here we want a single digit after float
Note: The value of the slider is directly stored into the variable. So, sepal_length in sepal_length = st.slider() will store the current value for the slider.
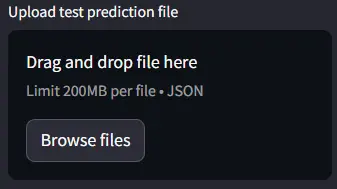
When working with machine learning models in practical applications, practitioners often need to handle various file formats such as CSV, JSON, Excel, and others. Instead of using sliders or other input methods, we will leverage the st.file_uploader widget to allow users to upload a JSON file. This JSON file can then be previewed using st.json before sending the data for prediction by the model.
test_input_file = st.file_uploader('Upload test prediction file',type=['json'])
The above function accepts two arguments: a message to display to the user, and a list of permitted file types. In our case, we will specify JSON as the only accepted file type.
Check the documentation for additional arguments st.file_uploader.
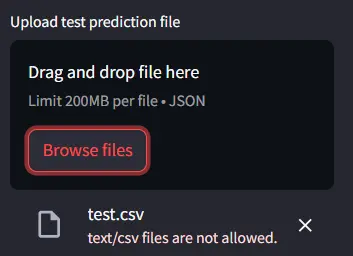
It is important to note that since the permitted file type is set to json, if the user attempts to upload a file of any other format, such as CSV, Streamlit will display a warning message. In this scenario, the application will not proceed with sending a prediction request.
The st.json widget provides a convenient way to preview the contents of the uploaded JSON file. This preview functionality allows the user to validate and ensure the information is correct before proceeding with the prediction process.
An example test.json file
{
    "input_test" : {
        "sepal_length": 2.5,
        "sepal_width": 3.5,
        "petal_length": 1.5,
        "petal_width": 2.5
    }
}
The next key information is st.session_state. In Streamlit applications, st.session_state is a way to store and persist data across multiple user interactions with the app. It acts like a client-side cache, storing variables and data in the user’s browser session.
st.session_state["IS_JSON_FILE_AVAILABLE"] = True
Finally, to finish the sidebar panel, let’s add the most important element, i.e., the predict button.
predict_button = st.button('Predict')

Building the body
The body will show the heading for the dashboard, and the prediction output.
For the heading, the st.write function Swiss Army knife of Streamlit and can render various forms of text output.
st.write("# Iris Flower Prediction! 🪻")
For the prediction output, we create a placeholder.
result_container = st.empty()
The st.empty adds a container into your app that can be used to hold a single element. This allows you to, for example, remove elements at any point, or replace several elements at once (using a child multi-element container).
In Streamlit, the st.spinner and st.toast are two utility functions that will help us create better user experiences and provide feedback to users while their requests are being processed or completed.
-
st.spinner: Function is used to display a spinning animation or progress indicator to the user.
-
st.toast: Function is used to display a temporary message or notification to the user
Finally, piecing together all this information gives
st.write("# Iris Flower Prediction! 🪻")
if predict_button:
    if FASTAPI_IRIS_MODEL_LOCATION.is_file():
        client_input = json.dumps({
            "petal_length": petal_length,
            "sepal_length": sepal_length,
            "petal_width": petal_width,
            "sepal_width": sepal_width
        })
        try:
            result_container = st.empty()
            with st.spinner('Predicting...'):
                predict_iris_response = requests.post(f'{FASTAPI_BACKEND_ENDPOINT}/predict', client_input)
            if predict_iris_response.status_code == 200:
                iris_content = json.loads(predict_iris_response.content)
                start_sentence = "The flower predicted is: "
                if iris_content["response"] == 0:
                    result_container.success(f"{start_sentence} setosa")
                elif iris_content["response"] == 1:
                    result_container.success(f"{start_sentence} versicolor")
                elif iris_content["response"] == 2:
                    result_container.success(f"{start_sentence} virginica")
                else:
                    result_container.error("Some problem occured while prediction")
                    LOGGER.error("Problem during prediction")
            else:
                st.toast(f':red[Status from server: {predict_iris_response.status_code}. Refresh page and check backend status]', icon="🔴")
        except Exception as e:
            st.toast(':red[Problem with backend. Refresh page and check backend status]', icon="🔴")
            LOGGER.error(e)
    else:
        LOGGER.warning('iris_model.pkl not found in FastAPI Lab. Make sure to run train.py to get the model.')
        st.toast(':red[Model iris_model.pkl not found. Please run the train.py file in FastAPI Lab]', icon="🔥")
Additional information
The above code generates a SPA (Single Page Application) that could act as a self-contained dashboard. However, in most cases, we aim to develop multi-page applications. Streamlit offers a straightforward, predefined structure for building multi-page applications. The process is as simple as adding additional pages to the Pages directory, following a naming convention like 1_A, 2_B, 3_C, and so on, where A, B, and C represent different pages, respectively. For more detailed information, you can refer to the official Streamlit documentation on creating a multi-page app. Docs link
Running Lab on Google Colab
This lab has additional support to run on free instance of Google Colab. This enables sharing the lab while the Google Colab instance is running. Here is the link to the demo lab.