Table of Contents
1. Overview
To ensure the reliability of Medify AI, a comprehensive monitoring system tracks model performance, data drift, and retrieval accuracy. Since the system uses a pre-trained model, retraining is not possible, making continuous monitoring essential to detect issues early.
The key monitoring components include:
- Data drift detection to ensure input data remains consistent
- Retrieval performance tracking to monitor the accuracy of the RAG system
- Real-time system monitoring using Prometheus and Grafana
2. Model and Data Drift Monitoring
2.1 Why is monitoring needed?
- Ensures the retrieval-augmented generation (RAG) system provides accurate and relevant responses
- Detects changes in input data that could impact model predictions
- Alerts the team if performance degrades below acceptable levels
2.2 How do we monitor data drift?
- Retrieval score threshold: If the similarity score of retrieved cases falls below 0.5, an alert is triggered
- Embedding updates: A Lambda function generates embeddings for new patient records and updates the Pinecone vector database
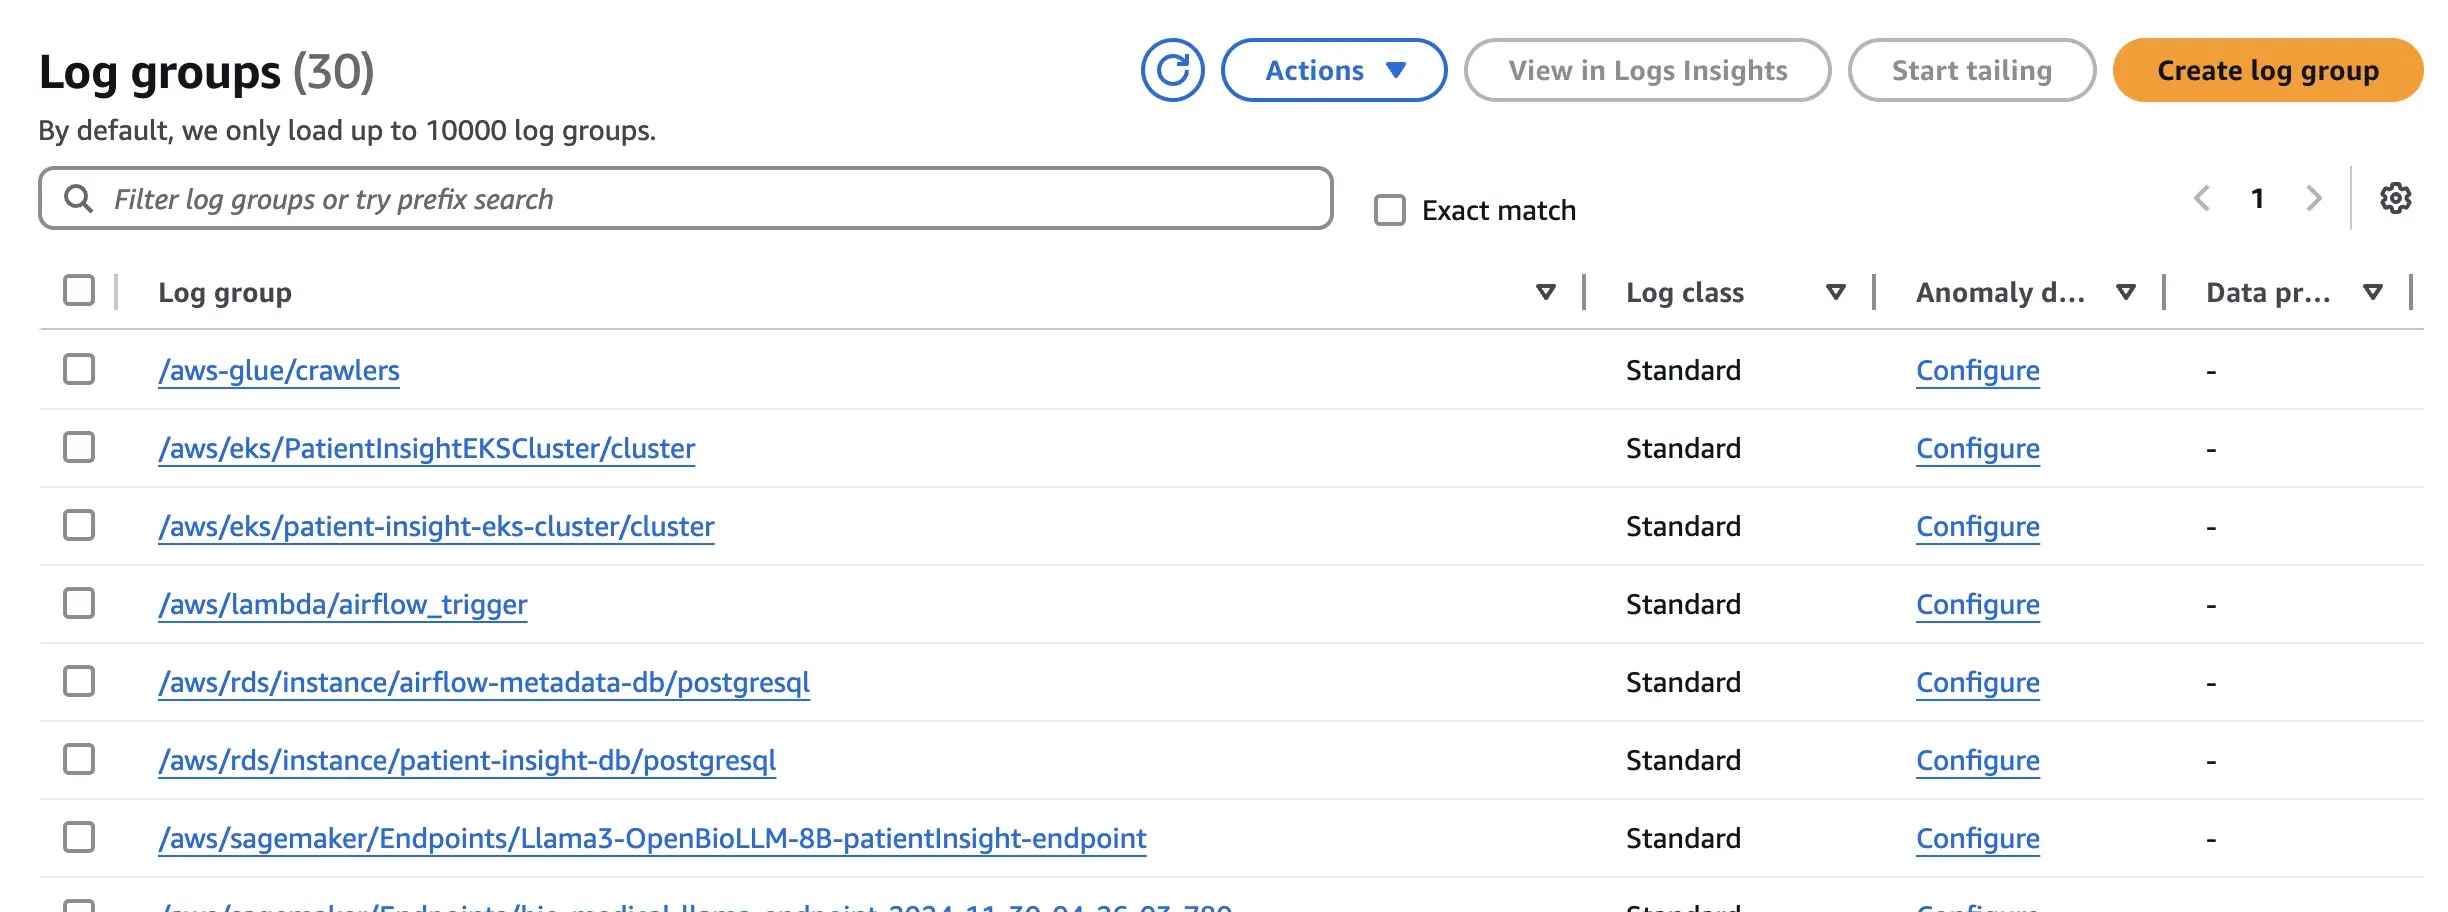
- CloudWatch alerts track drift trends and log failures
3. Real-Time Monitoring with Prometheus and Grafana

3.1 Why use Prometheus and Grafana?
- Prometheus collects metrics from all system components
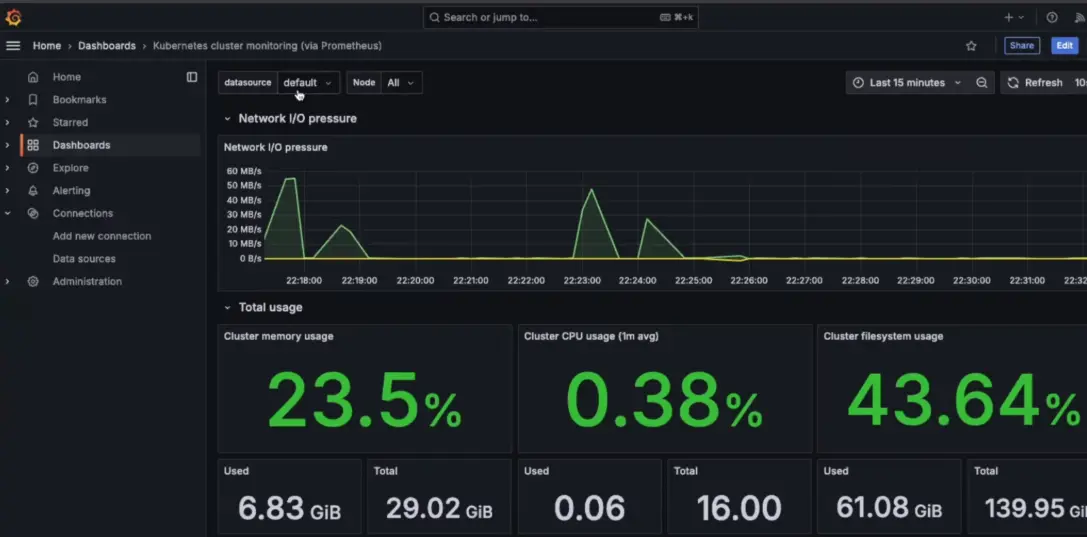
- Grafana provides a visual dashboard for real-time tracking
- Allows quick troubleshooting and alerting when anomalies occur
3.2 What do we monitor?
- API response times to detect latency in chatbot interactions
- Embedding update failures to ensure new data is processed correctly
- RAG system accuracy to check retrieval success rates
- Memory and CPU usage to monitor system health and scaling needs
3.3 How does it work?
- Prometheus scrapes metrics from AWS services, Kubernetes, and APIs
- Grafana visualizes system health with real-time graphs
- If an issue is detected, alerts are sent via Slack or email
4. Monitoring System Architecture
The following diagram illustrates the Cloud Run monitoring setup.

5. Alerting System
5.1 What happens when issues arise?
- Retrieval score below 0.5 triggers notifications to engineers via Slack
- API latency spikes prompt CloudWatch to trigger auto-scaling
- Service failures cause AWS Lambda to restart the affected service
5.2 How do alerts help?
- Prevent downtime and inaccurate medical recommendations
- Provide real-time insights for proactive fixes
- Help scale the system dynamically to maintain smooth operations
6. Conclusion
Monitoring in Medify AI ensures stable, accurate, and scalable performance.
- Prometheus and Grafana track real-time metrics
- CloudWatch and Lambda handle alerting and automation
- Retrieval performance is continuously checked to maintain quality
By integrating automated monitoring and alerting, Medify AI guarantees high system reliability and patient data accuracy.